Go back
Top selling products
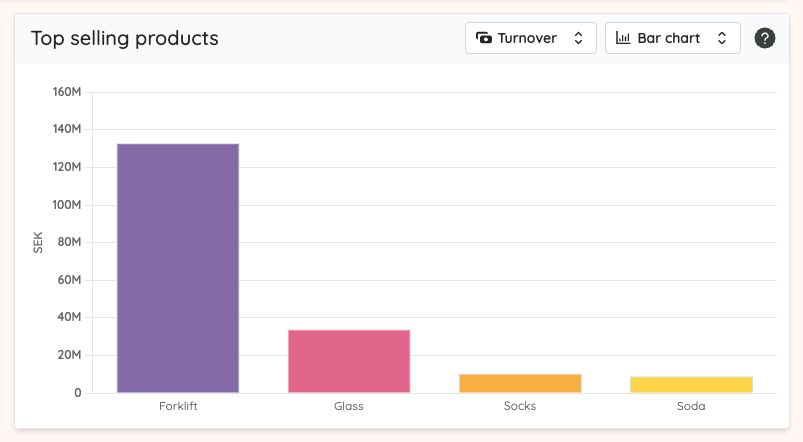
The top-selling products widget tries to show you sales volume on a product basis.
Bar chart
The start view shows you your top-selling products based on total revenue per product. You can click the dropdown to show the top products based on units sold if you wish.
Scatter chart
The scatter chart is a combination of revenue and the number of units sold. The Y-axis represents revenue and the X-axis represents units sold, and the product will be placed into the chart where the lines for a product intersect.
© Briqpay, 2022


