Go back
Order history
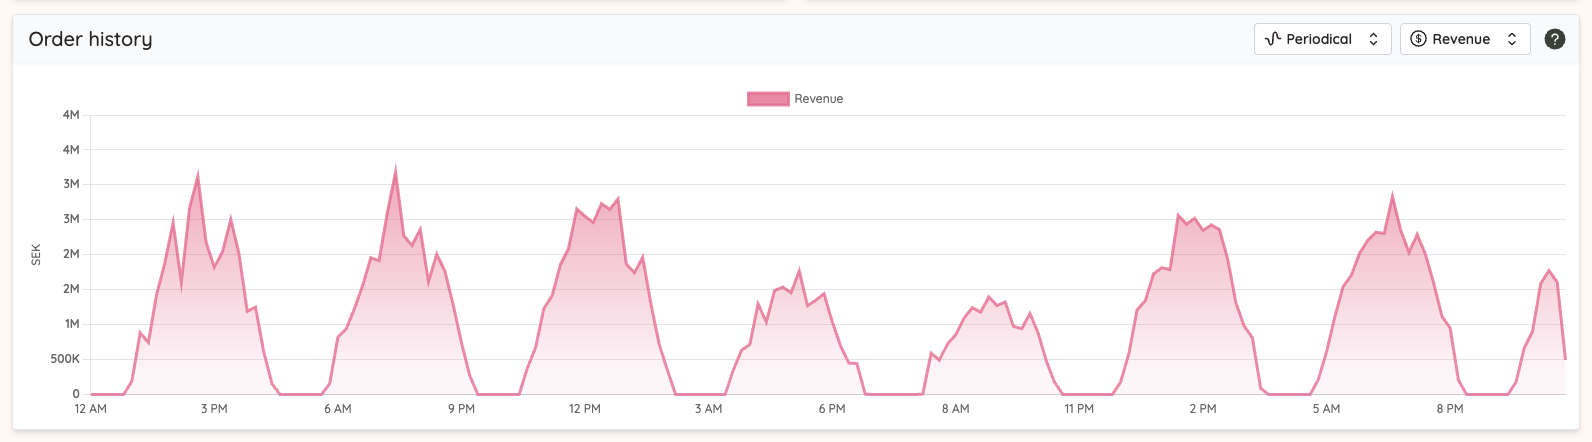
Periodical view
The base layout of your order history shows a graph with the total sales amount for each hour, day or week on the y-axis and time on the x-axis for your selected time span.
Accumulative view
The accumulative view will show you the total sales amount for the selected time span, aggregated together over time.
Revenue setting
Set the graph to contain total sales revenue.
Number of orders
Change the graph to show the number of orders for the time span instead of revenue.
Average order value
Change the graph to show the average order value for the selected time span.
© Briqpay, 2022


