
More insights

Co-founder Briqpay
August 27, 2026 at 07:00 AM
Refund data does not usually get much attention on its own. Most merchants look at it as a cost line, a customer service metric, or a fraud signal, and rarely as a window into how differently their shoppers behave depending on how they choose to pay. At Briqpay we sit across a large number of checkouts, which means we also see a large number of refunds, and refunds turn out to be a genuinely useful proxy for order value: in the overwhelming majority of cases, a refund reflects all or most of what a customer originally paid.
We pulled tens of thousands of refund transactions from our network and grouped every underlying payment method into six categories that most merchants will recognise from their own checkout: card, digital wallet (Apple Pay and Google Pay), PayPal, BNPL and pay-by-instalment products, mobile payment apps (Swish, Vipps, Twint and similar), and bank transfer or open banking redirects (iDEAL, Bancontact, SEPA and similar). No individual provider is named anywhere in this piece, on purpose. We are interested in the shape of the category, not in ranking specific processors or schemes against each other.
We deliberately left invoice and other pay-after-delivery products out of this analysis. That category in our data leans heavily B2B and follows a different underlying logic, businesses paying on trade credit terms, that does not compare cleanly against consumer-facing checkout choices like a card or a wallet tap. It deserves its own piece, not a footnote in this one.
Every figure below is a share of refund count or a ratio against the card average within the same country, both of which are currency-free and safe to compare across markets. We have deliberately kept absolute order and refund values out of this piece entirely; the pattern is the interesting part, not the underlying scale.

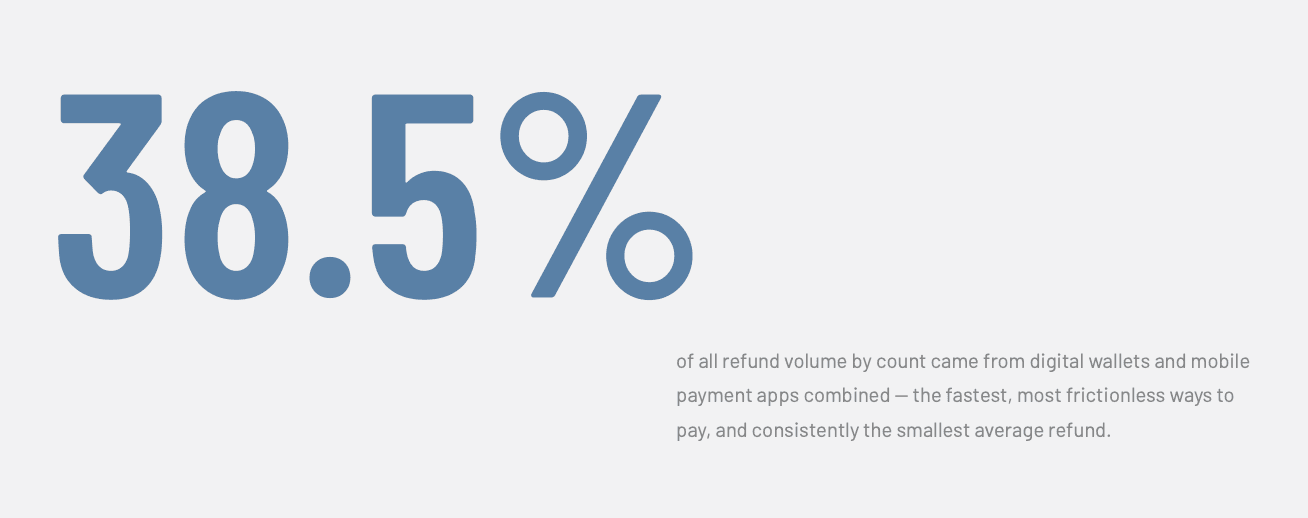
Across the whole dataset, two groups account for close to four in ten of every refund we processed: digital wallets and mobile payment apps together made up 38.5% of refund volume by count. These are the fastest, most frictionless ways to pay, tap a phone, confirm with a fingerprint or a face, done in seconds. They are also, consistently, the groups with the smallest average refund value.
We compared each group's average refund amount against the card average in every country where we had enough volume to make the comparison meaningful. Wallets came out below card in every single market we could check, seven countries with real volume (Sweden, the UK, Germany, Norway, Denmark, France and the US), ranging from 28% of the card average in France to 80% in the UK. Mobile payment apps showed the same pattern even more sharply: in both markets where we had enough data to compare (Sweden and Denmark), the average mobile payment refund sat at just under a third of the card average.
This lines up with a broader pattern that shows up whenever anyone compares mobile and desktop commerce more generally. A large analysis of more than 65 million WooCommerce orders found that desktop shoppers spend on average $167 per order compared to $71 on mobile and tablet devices, a gap of roughly 2.3 times, even though mobile now accounts for the majority of order volume. Wallets are overwhelmingly a mobile-first way to pay, so it is a reasonable read, and we want to flag this as an interpretation, not something our data proves directly, that wallet refunds are small partly because the underlying purchases skew toward the same lower-consideration, higher-frequency mobile basket that shows up in that wider research.
BNPL is usually talked about as the payment method that captures the biggest, most considered purchases, and there is real research behind that reputation. An analysis by Stripe covering more than 150,000 checkout sessions found that offering BNPL tends to increase both conversion and average order value, and some industry estimates put that AOV lift as high as 20 to 40%.
Our refund data tells a more mixed story. In every market where we had enough BNPL volume to check (Sweden, the UK, Germany, the Netherlands, Norway and Austria), the average BNPL refund came in at or below the card average, from 48% of the card figure in the UK up to 97% (essentially parity) in Norway, the only market where BNPL and card were close. If BNPL really were systematically capturing the biggest baskets, we would expect BNPL refunds to skew larger than card refunds too, and in every one of those six markets, they did not.
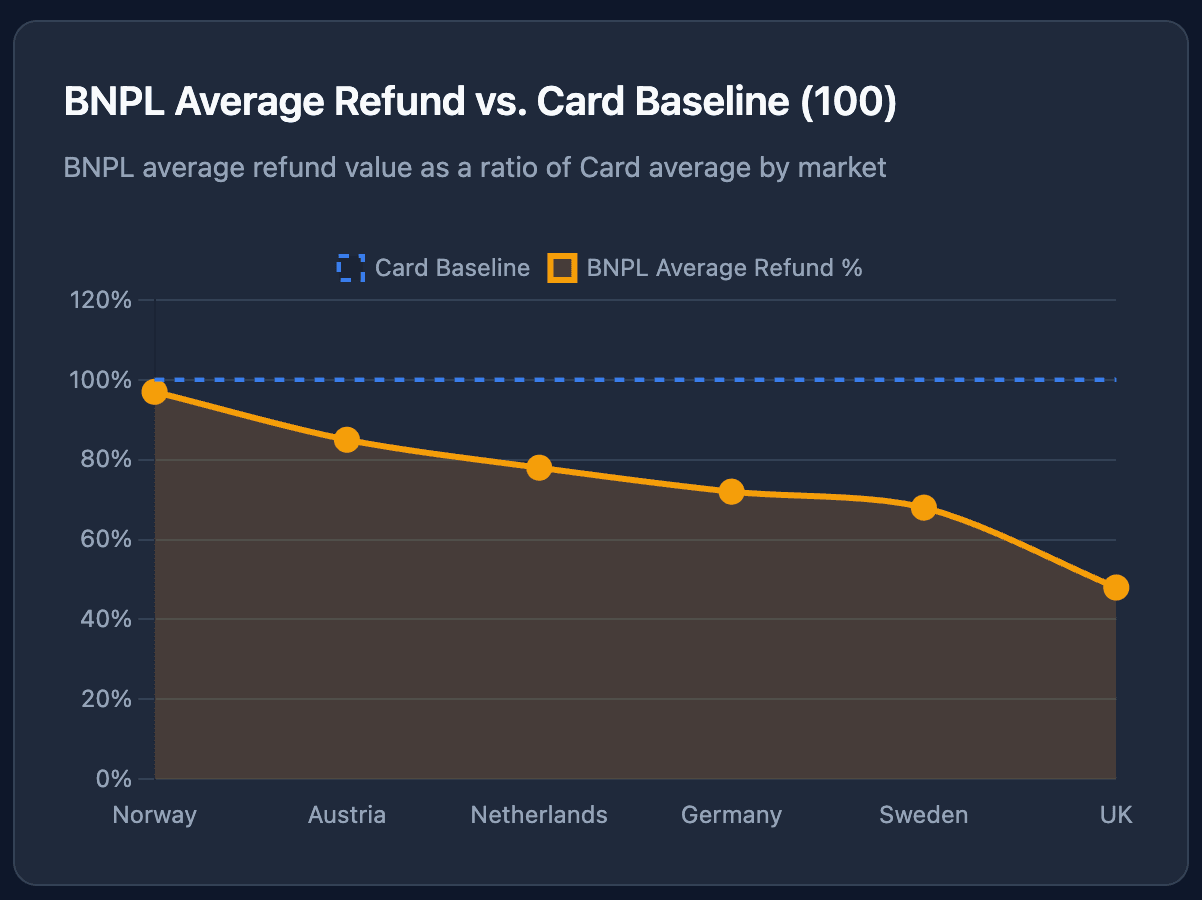
Our data is not measuring quite the same thing as the AOV research above (we are looking at what gets refunded, not what gets ordered), so we would not want to overstate the contradiction. One plausible explanation, and this is our interpretation, not something the data confirms outright, is that BNPL's AOV lift comes mostly from converting shoppers who would otherwise have abandoned a mid-sized basket, not from capturing unusually large ones, which would not necessarily show up as a large average refund. Either way, it is a useful reminder that "BNPL means bigger baskets" is a generalisation worth checking against your own numbers, not simply assuming.
Comparing countries against each other always means comparing different currencies, which is exactly why we have stuck to ratios so far. To show what the pattern looks like within one currency, without publishing any actual order or refund values, we picked Sweden, one market where we had coverage across every group, and indexed each group's average refund value against card, with card set at 100:
Bank transfer methods indexed noticeably higher again in this market, but on a sample far too small to draw a real conclusion from, so we are flagging it instead of building an argument on it.
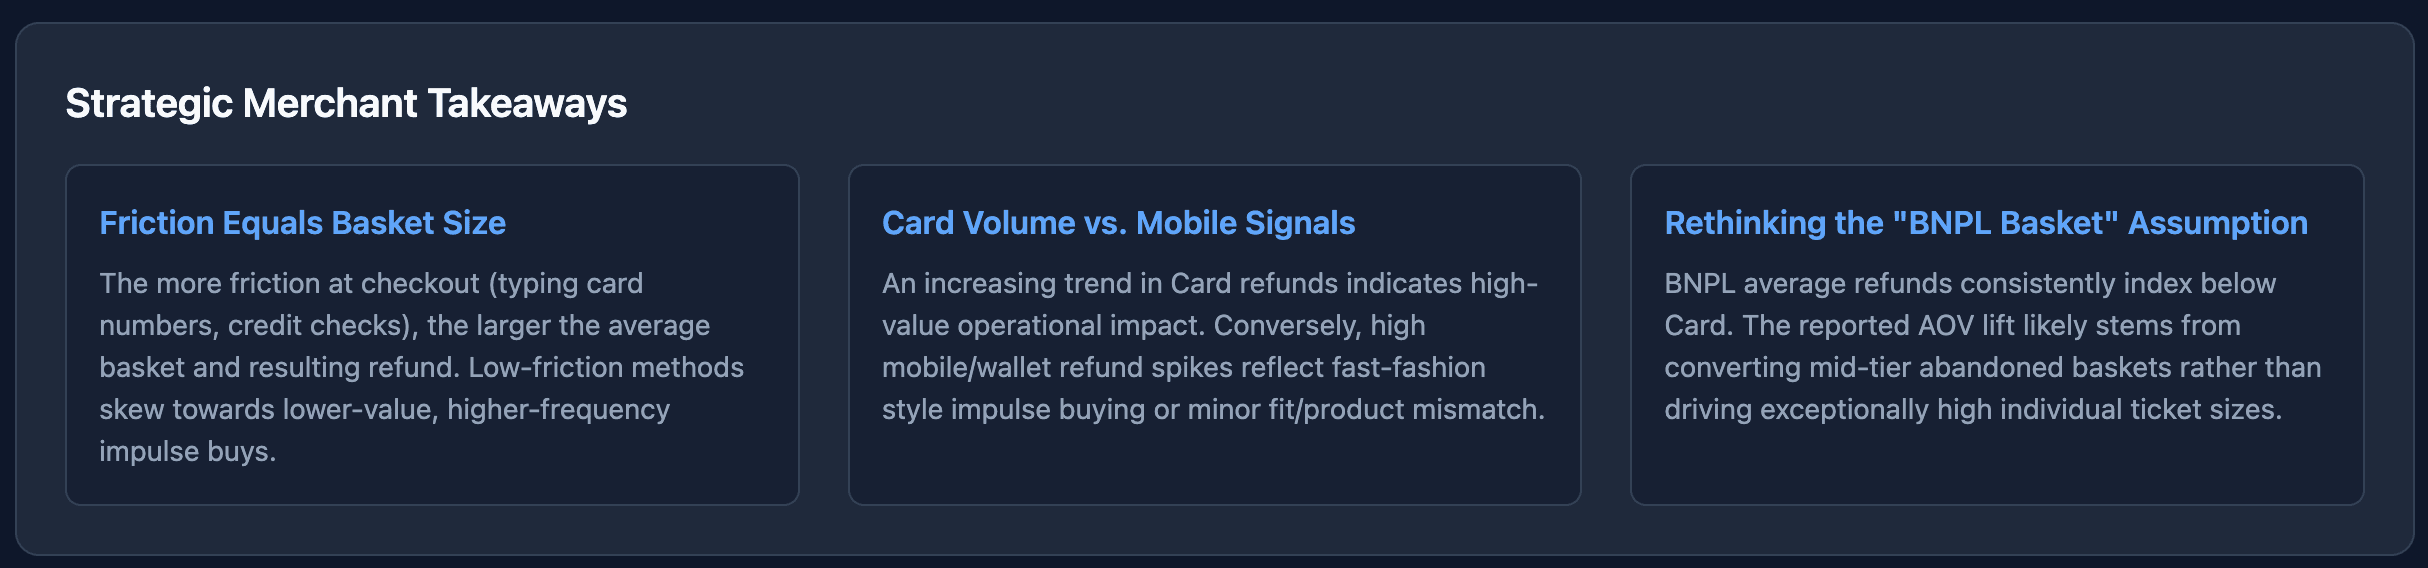
What stands out here is the clean, almost stepped ordering: card sits clearly at the top, PayPal and BNPL sit in the middle, and the two fastest, most app-driven ways to pay, wallets and mobile payment, sit at the bottom, with mobile payment indexing at less than a third of card. It is a tidy illustration of the wider pattern: the more friction a shopper is willing to accept at checkout (a credit check, typing out a card number), the larger the basket tends to be on average, and the faster and more frictionless the method, the smaller it tends to be.
None of this means merchants should push shoppers toward slower payment methods. Conversion research consistently shows the opposite: offering fast, low-friction options like wallets and mobile payment apps increases completed sales, and losing a sale to friction is a far bigger cost than a slightly smaller basket. What this data is useful for is something more specific: reading your own refund numbers correctly.
If your card refund volume is trending up, that is a different signal than the same trend in wallets or mobile payment, because it is likely happening on materially larger average order values, and it deserves proportionally more attention from a cash flow and operations standpoint even if the transaction count looks small next to your wallet or mobile payment refund count. Conversely, a spike in wallet or mobile payment refunds is a high-frequency, lower-value signal, more likely to be about product fit, sizing, or fast-fashion style impulse purchases than about the kind of considered, higher-ticket dissatisfaction that a card refund often represents.
For merchants offering BNPL, especially as frameworks like the EU's Consumer Credit Directive (CCD2) bring more structure to how these products are disclosed and monitored, it is worth remembering that BNPL refunds do not automatically skew toward your highest-value orders, at least not in this data. Treating it as your default "big basket" payment method risks misreading what is actually happening in your own numbers.
Refund behaviour is one more data point pointing the same direction: read what actually reduces checkout costs and cart abandonment for how it ties together with payment switching, failed payments and basket size.
The same market-by-market divergence shows up in how shoppers choose to pay, not only in refunds: see why checkout speed is solved but payment preference isn't.
On Black Friday 2025, Swedish and Dutch shoppers moved six points toward pay later, Germans moved to wallets and the British stayed with cards. Our consumer checkout data, market by market, and what to put first in each checkout this year.
Card payments acquired in the shopper's own country are approved more often, and between the UK and the EU they can cost five times less. What local acquiring is, what it saves and how to set it up across the Nordics.
CCD2 brings buy now pay later and invoice under consumer credit law on 20 November 2026. What changes at checkout, which countries are ready (the Netherlands and Norway are not), and how exposed each market is, with our own checkout data.
Connect any payment provider. Optimize your payment flow. Scale without limitations - with Briqpay’s Payment Integration Platform.
